
In my previous blog post about point-to-point antenna alignment, I wrote about some best case practices of doing so with the classic method – RSSI alignment. Here, I’ll describe a different, more effective way of aligning antennas, regardless of their size. This method involves using a spectrum analyzer.
Naturally, some of you will object, saying that spectrum analyzers for point-to-point radio frequencies are very expensive and are an unnecessary luxury item. With that in mind, SAF Tehnika has created an affordable series of spectrum analyzers, which are the smallest (pocket sized) standalone devices in the world. You can find more information here: https://saftehnika.com/en/spectrumanalyzer.
However, this post isn’t intended as a commercial for a specific product – nearly any spectrum analyzer can be used for antenna alignment. The difference between analyzers will be in how easy, fast, and convenient the process is.
First, we have to remember why it is important to properly align antennas, and that each missing dB can play a role in link performance, especially in regards to the SLA that is agreed with the customer. Every missed dB will increase annual link downtime and decrease its availability, which can be a drawback for potential customers, whether you are a service provider, mobile operator, or an installation and maintenance company.
In general, there are two potential issues when aligning antennas. First – when aligning small antennas, it is difficult to avoid the side lobes. Second – with larger antennas (6ft/1.8m and more), the difficulty lies in finding the initial signal.
How does a spectrum analyzer help in resolving these two issues? I will give examples using the Spectrum Compact, a spectrum analyzer manufactured by SAF Tehnika.
A spectrum analyzer is an instrument used to measure the magnitude of the signal versus frequency. In other words, if the received signal level is -50dBm, the radio interface will display only this number, while a spectrum analyzer will show the shape and strength of the signal. An example is given below.

A key parameter of any antenna is its radiation pattern. It describes how the antenna will transmit the signal. Looking at the radiation pattern, it is immediately clear that the signal propagates in multiple paths (directions). These paths are called lobes. Each antenna has a main lobe and several side lobes. The difference in amplification (signal strength) between the main lobe and side lobes is typically around 20 dB. This, of course, varies with antenna size, frequency, and class. Small antennas in low frequencies typically have strong side lobes, which sometimes results in installation crews aligning the antenna on a side lobe instead of the main lobe.
When an antenna sweep is performed and an initial signal is found, installers typically stick with this first signal and do not continue the antenna sweep. If this initial signal happens to be a side lobe, the antenna will most likely be aligned to it, resulting in poor link performance. Performing the initial antenna sweep with a voltmeter or by using the radio’s built-in indicators will only give you a number value, without any idea of what signal the antenna is being aligned to. Accuracy of the Voltmeter (RSSI) method depends on the accuracy of the radio itself, its user interface refresh speed and sensitivity level.
Benefits of using a Spectrum Compact (spectrum analyzer) include:
- A better receiver sensitivity than a radio has, making it possible to quickly spot the initial signal
- Better sweep speed/refresh rate, which makes for faster antenna sweeps
- EMC protection and precision of a test and measurement device – these results can be used as proof of any potential issues
- Better resolution – it is possible to identify and align to the correct signal. Radios typically have wide receiver filters, so the power reading values can be affected by adjacent channels
- Visual representation of the signal. This helps to determine potential issues, such as reflections, interference, and damaged hardware
- Signal level is measured in dBm – there is no need to convert voltage to dBm
Nearly every spectrum analyzer, including Spectrum Compact, comes with multiple possible trace modes. The displayed data will depend on the chosen trace mode. For example, “max hold” trace mode will add another spectrum curve on the screen, displaying the maximum achieved signal strength in this trace mode. This is very helpful in antenna alignment, as you no longer need to memorize the highest achieved signal levels, with them being displayed on the screen after a full antenna sweep. In order to align the antenna on the main lobe, you just have to turn it back until the real-time reading matches the previously registered “max hold” curve. In addition to that, you will also be able to verify that there is no interference and that the antenna is not aligned on a reflected signal.
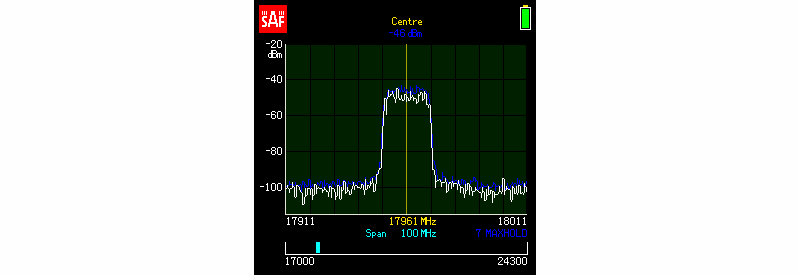
Let me give you an example of a spectrum curve of a properly aligned antenna, along with a “max hold” trace on the screen. From the picture, you can see that:
- The real-time reading (white line) matches the “max hold” curve (blue line)
- Top of the signal is even without any notches or spikes. This means that there are no reflections, hardware failures, or unexpected fading
- Adjacent channels do not have any signals, so the spectrum is clear and the installed link should not suffer from any interference issues
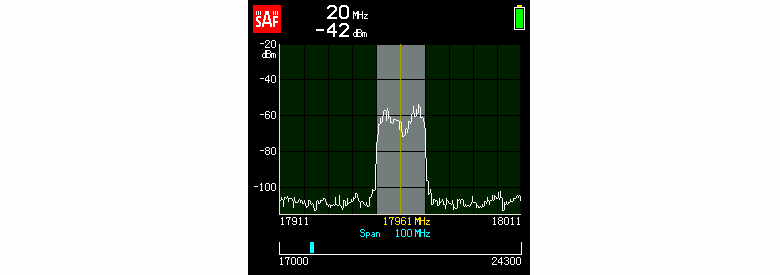
In order to determine the absolute power of the signal, it is necessary to use the Spectrum Compact’s “power in band” function. In other spectrum analyzers, the function might also be called “channel power measurement”. This is a mathematical function that sums all the separate spectrum energy points and provides the absolute power level of the signal. In other words, the absolute power level is the number that shows up in the radio management graphical interface and is provided in link budget calculations.

Here is another example, showing how a spectrum analyzer can help to identify issues with radio signal propagation during the installation process. We can see that the “power in band” value matches the link budget calculation, but the signal curve is damaged.
This phenomenon does not affect the power values, but definitely affects the signal to noise ratio, so the link would not be able to perform as expected. If the classic voltmeter method was used, this would not be noticed during the installation and the troubleshooting team would have to return to the site to find this problem.
In my next post, I will share a similar approach for aligning larger antennas by using a spectrum analyzer and a reference antenna!
If you found this article useful, please like and share it.
Be sure to subscribe to our blog and follow us on Twitter; Facebook; YouTube and LinkedIn